Electrify Chicago
According to the
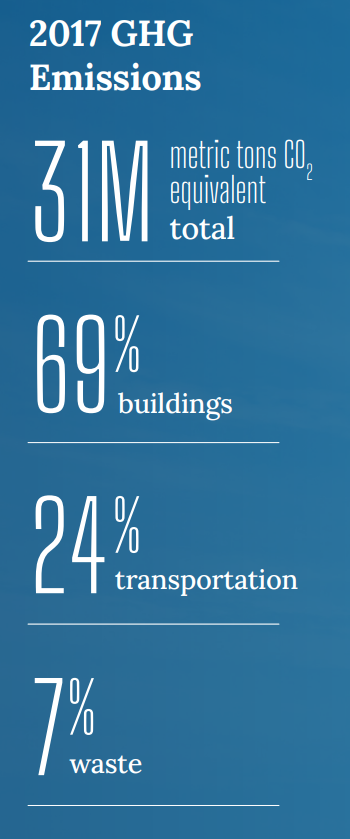
2022 Chicago Climate Action Plan ,
a whopping 69% of Chicago's emissions come from buildings, making it
our biggest challenge and our biggest opportunity as a city to tackle
change. At Electrify Chicago we want to showcase some of the best and worst performing
buildings in the city using publicly available data and manual annotations to add
building photographs and label multi-building owners like universities.
,
a whopping 69% of Chicago's emissions come from buildings, making it
our biggest challenge and our biggest opportunity as a city to tackle
change. At Electrify Chicago we want to showcase some of the best and worst performing
buildings in the city using publicly available data and manual annotations to add
building photographs and label multi-building owners like universities.
You can start by looking at Chicago's buildings with the highest greenhouse gas intensity - this means that they use the most energy when adjusted per unit of square foot, so big buildings could actually perform much better than very inefficient small buildings on this metric.
Legislative update! 🎉
As of late January 2024, legislation is being introduced to require new buildings use more efficient forms of water and space heating, via the Clean And Affordable Buildings Ordinance (CABO), which will reduce the number of highly polluting and inefficient that end up on this site.
If you're in Chicago,
write to your alderman to support the CABO!
Chicago Buildings by Greenhouse Gas Intensity
Note: Data only includes large Chicago buildings from 2021, unless explicitly stated otherwise.
Note: This data only includes buildings whose emissions are reported
under the
Chicago Energy Benchmarking Ordinance. According to the City “As of 2016,
this list includes all commercial, institutional, and residential buildings larger than
50,000 square feet.” This dataset is also then filtered to only buildings with
reported emissions > 1,000 metric tons CO2 equivalent.
This data is also from 2021, but when new benchmark data is available, we'll update the site.
| Property Name / address | Primary Property Type |
Greenhouse Gas Intensity (kg CO2 eq./sqft) |
Total Greenhouse Emissions (metric tons CO2 eq.) |
|---|---|---|---|
|
Museum Pointe CA
233 E 13th St
| Multifamily Housing | 4.5 kg/sqft
Lowest 16%
| 1,817 tons
Highest 26%
|
|
Daniel R Cameron Elementary School
(CPS)
1234 N Monticello Ave
| K-12 School | 4.5 kg/sqft
Lowest 16%
| 620 tons
Lowest 36%
|
|
3260 North Lake Shore
3260 N LAKE SHORE DR
| Multifamily Housing | 4.5 kg/sqft
Lowest 16%
| 1,166 tons
Highest 39%
|
|
Ivy at Carlson
1401 E HYDE PARK BLVD
| Multifamily Housing | 4.5 kg/sqft
Lowest 16%
| 250 tons
Lowest 5%
|
|
813-31 West Waveland
813 831 W WAVELAND AVE
| Multifamily Housing | 4.5 kg/sqft
Lowest 16%
| 225 tons
Lowest 4%
|
|
Westminster Condominium Association
36 50 N MENARD AVE
| Multifamily Housing | 4.5 kg/sqft
Lowest 16%
| 308 tons
Lowest 10%
|
|
Sono East - CO (ss78)
840 W Blackhawk St
| Multifamily Housing | 4.5 kg/sqft
Lowest 16%
| 1,428 tons
Highest 33%
|
|
500 Lake Shore Drive
500 N Lake Shore Dr
| Multifamily Housing | 4.5 kg/sqft
Lowest 16%
| 3,250 tons
Highest 12%
|
|
33 West Ontario Street
33 W Ontario St
| Multifamily Housing | 4.5 kg/sqft
Lowest 16%
| 4,661 tons
Highest 8%
|
|
Kenmore Plaza Tenants Association
(CHA)
5225 N Kenmore Ave
| Multifamily Housing | 4.5 kg/sqft
Lowest 16%
| 1,203 tons
Highest 39%
|
|
Park Edgewater Condominium Association
6101 N Sheridan Road
| Multifamily Housing | 4.5 kg/sqft
Lowest 16%
| 669 tons
Lowest 40%
|
|
1601 W Division LLC
1611 W DIVISION ST
| Multifamily Housing | 4.5 kg/sqft
Lowest 16%
| 485 tons
Lowest 26%
|
|
225 W. Ohio
225 W Ohio St
| Office | 4.5 kg/sqft
Lowest 16%
| 273 tons
Lowest 7%
|
|
Renaissance North - Avanath
(CHA)
551 557 W NORTH AVE
| Multifamily Housing | 4.5 kg/sqft
Lowest 16%
| 283 tons
Lowest 8%
|
|
Trevi Square Condominium Association
1439 S MICHIGAN AVE
| Multifamily Housing | 4.5 kg/sqft
Lowest 16%
| 463 tons
Lowest 23%
|
Data Source:
Chicago Energy Benchmarking Data