Electrify Chicago
According to the
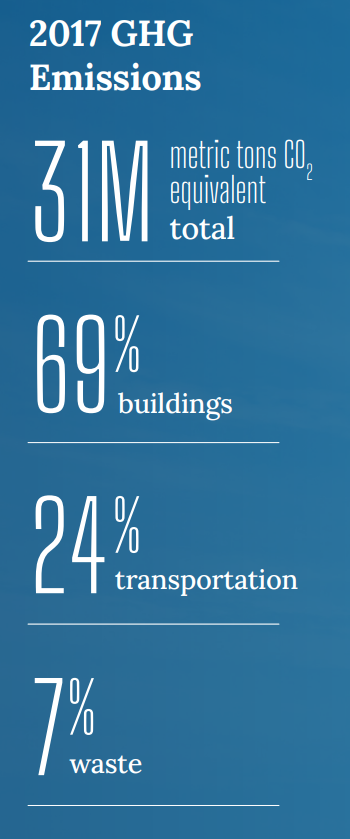
2022 Chicago Climate Action Plan ,
a whopping 69% of Chicago's emissions come from buildings, making it
our biggest challenge and our biggest opportunity as a city to tackle
change. At Electrify Chicago we want to showcase some of the best and worst performing
buildings in the city using publicly available data and manual annotations to add
building photographs and label multi-building owners like universities.
,
a whopping 69% of Chicago's emissions come from buildings, making it
our biggest challenge and our biggest opportunity as a city to tackle
change. At Electrify Chicago we want to showcase some of the best and worst performing
buildings in the city using publicly available data and manual annotations to add
building photographs and label multi-building owners like universities.
You can start by looking at Chicago's buildings with the highest greenhouse gas intensity - this means that they use the most energy when adjusted per unit of square foot, so big buildings could actually perform much better than very inefficient small buildings on this metric.
Legislative update! 🎉
As of late January 2024, legislation is being introduced to require new buildings use more efficient forms of water and space heating, via the Clean And Affordable Buildings Ordinance (CABO), which will reduce the number of highly polluting and inefficient that end up on this site.
If you're in Chicago,
write to your alderman to support the CABO!
Chicago Buildings by Greenhouse Gas Intensity
Note: Data only includes large Chicago buildings from 2021, unless explicitly stated otherwise.
Note: This data only includes buildings whose emissions are reported
under the
Chicago Energy Benchmarking Ordinance. According to the City “As of 2016,
this list includes all commercial, institutional, and residential buildings larger than
50,000 square feet.” This dataset is also then filtered to only buildings with
reported emissions > 1,000 metric tons CO2 equivalent.
This data is also from 2021, but when new benchmark data is available, we'll update the site.
| Property Name / address | Primary Property Type |
Greenhouse Gas Intensity (kg CO2 eq./sqft) |
Total Greenhouse Emissions (metric tons CO2 eq.) |
|---|---|---|---|
|
Post Card Place CA
1733 1735 W IRVING PARK RD
| Multifamily Housing | 4.5 kg/sqft
Lowest 16%
| 413 tons
Lowest 19%
|
|
219 E Lake Shore CA
219 227 E LAKE SHORE DR
| Multifamily Housing | 4.5 kg/sqft
Lowest 16%
| 876 tons
Lowest 50%
|
|
1540 Lake Shore Dr
1534 1542 N LAKE SHORE DR
| Multifamily Housing | 4.5 kg/sqft
Lowest 16%
| 627 tons
Lowest 37%
|
|
1340 N Dearborn Condominium Association
1340 N DEARBORN ST
| Multifamily Housing | 4.5 kg/sqft
Lowest 16%
| 480 tons
Lowest 25%
|
|
CUMBERLAND CROSSING CONDOMINIUM
5555 N CUMBERLAND AVE
| Multifamily Housing | 4.5 kg/sqft
Lowest 16%
| 600 tons
Lowest 35%
|
|
399 Corporation
399 W FULLERTON PKWY
| Multifamily Housing | 4.5 kg/sqft
Lowest 16%
| 586 tons
Lowest 34%
|
|
Malden Property LLC
4501 4519 N MALDEN ST
| Multifamily Housing | 4.5 kg/sqft
Lowest 16%
| 357 tons
Lowest 14%
|
|
33E. Condo Association
27 39 E CEDAR ST
| Multifamily Housing | 4.5 kg/sqft
Lowest 16%
| 726 tons
Lowest 43%
|
|
Morgan Park High School
(CPS)
1744 W Pryor Ave
| K-12 School | 4.5 kg/sqft
Lowest 16%
| 1,209 tons
Highest 38%
|
|
William J Bogan High School
(CPS)
3939 W 79th St
| K-12 School | 4.5 kg/sqft
Lowest 16%
| 840 tons
Lowest 48%
|
|
18/ST Condominiums
1802 S STATE ST
| Multifamily Housing | 4.4 kg/sqft
Lowest 14%
| 242 tons
Lowest 5%
|
|
Alta Roosevelt (lz28)
801 S Financial Place
| Multifamily Housing | 4.4 kg/sqft
Lowest 14%
| 2,813 tons
Highest 14%
|
|
Carriage House (gc09)
1545 S State St
| Multifamily Housing | 4.4 kg/sqft
Lowest 14%
| 589 tons
Lowest 34%
|
|
Glen Lake I Condominium Association
6400 W Berteau
| Multifamily Housing | 4.4 kg/sqft
Lowest 14%
| 1,911 tons
Highest 24%
|
|
St. Paul Lofts Condominium Association
2333 W Saint Paul Ave
| Multifamily Housing | 4.4 kg/sqft
Lowest 14%
| 469 tons
Lowest 24%
|
Data Source:
Chicago Energy Benchmarking Data