Electrify Chicago
According to the
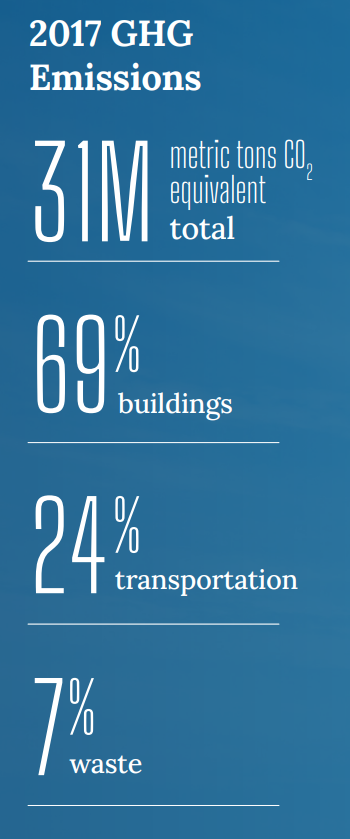
2022 Chicago Climate Action Plan ,
a whopping 69% of Chicago's emissions come from buildings, making it
our biggest challenge and our biggest opportunity as a city to tackle
change. At Electrify Chicago we want to showcase some of the best and worst performing
buildings in the city using publicly available data and manual annotations to add
building photographs and label multi-building owners like universities.
,
a whopping 69% of Chicago's emissions come from buildings, making it
our biggest challenge and our biggest opportunity as a city to tackle
change. At Electrify Chicago we want to showcase some of the best and worst performing
buildings in the city using publicly available data and manual annotations to add
building photographs and label multi-building owners like universities.
You can start by looking at Chicago's buildings with the highest greenhouse gas intensity - this means that they use the most energy when adjusted per unit of square foot, so big buildings could actually perform much better than very inefficient small buildings on this metric.
Legislative update! 🎉
As of late January 2024, legislation is being introduced to require new buildings use more efficient forms of water and space heating, via the Clean And Affordable Buildings Ordinance (CABO), which will reduce the number of highly polluting and inefficient that end up on this site.
If you're in Chicago,
write to your alderman to support the CABO!
Chicago Buildings by Greenhouse Gas Intensity
Note: Data only includes large Chicago buildings from 2021, unless explicitly stated otherwise.
Note: This data only includes buildings whose emissions are reported
under the
Chicago Energy Benchmarking Ordinance. According to the City “As of 2016,
this list includes all commercial, institutional, and residential buildings larger than
50,000 square feet.” This dataset is also then filtered to only buildings with
reported emissions > 1,000 metric tons CO2 equivalent.
This data is also from 2021, but when new benchmark data is available, we'll update the site.
| Property Name / address | Primary Property Type |
Greenhouse Gas Intensity (kg CO2 eq./sqft) |
Total Greenhouse Emissions (metric tons CO2 eq.) |
|---|---|---|---|
|
53100539 -- Chicago
🚩
3857 S DR MARTIN L KING JR DR
| Supermarket/Grocery Store | 26.2 kg/sqft #46 Highest
| 1,886 tons
Highest 24%
|
|
8791
🚩
(Northwestern)
300 E Superior Street
| Laboratory | 25.5 kg/sqft #47 Highest
| 7,737 tons
Highest 4%
|
|
03262- Chicago, IL
🚩
4660 W Irving Park Rd
| Supermarket/Grocery Store | 25.4 kg/sqft #49 Highest
| 1,800 tons
Highest 26%
|
|
03181- Chicago, IL
🚩
87 W 87th St
| Supermarket/Grocery Store | 25.4 kg/sqft #49 Highest
| 1,781 tons
Highest 26%
|
|
Wicker Park Commons (Jewel)
🚩
1341 N Paulina St
| Retail Store | 25.3 kg/sqft #50 Highest
| 1,325 tons
Highest 35%
|
|
University of Chicago Medical Center
🚨
(UChicago)
5841 S. Maryland Ave MC0985
| Hospital (General Medical & Surgical) | 25.2 kg/sqft
Highest 2%
| 137,221 tons #1 Highest
|
|
IN0035-21C Museum Hotel Chicago
55 E Ontario St
| Hotel | 25.0 kg/sqft
Highest 2%
| 1,797 tons
Highest 26%
|
|
Provident Hospital
🚩
500 E 51st St
| Hospital (General Medical & Surgical) | 24.9 kg/sqft
Highest 2%
| 9,307 tons
Highest 3%
|
|
00901- Chicago, IL
3400 N Western Ave
| Supermarket/Grocery Store | 24.8 kg/sqft
Highest 2%
| 1,381 tons
Highest 34%
|
|
03344- Chicago, IL
1220 S Ashland Ave
| Supermarket/Grocery Store | 24.8 kg/sqft
Highest 2%
| 1,569 tons
Highest 30%
|
|
70800570 -- Dan Ryan
112 W 87th St
| Supermarket/Grocery Store | 24.7 kg/sqft
Highest 2%
| 1,524 tons
Highest 31%
|
|
Rush University Medical Center
🚨
1653 W Congress Pkwy
| Hospital (General Medical & Surgical) | 24.7 kg/sqft
Highest 2%
| 96,018 tons #2 Highest
|
|
Saint Anthony Hospital - Main Hospital
2875 W 19th St
| Hospital (General Medical & Surgical) | 24.0 kg/sqft
Highest 2%
| 5,735 tons
Highest 6%
|
|
53100527--CHICAGO
2021 W Chicago Ave
| Supermarket/Grocery Store | 23.9 kg/sqft
Highest 2%
| 1,312 tons
Highest 36%
|
|
26 North Halsted
26 N Halsted St
| Office | 23.8 kg/sqft
Highest 2%
| 1,361 tons
Highest 34%
|
Data Source:
Chicago Energy Benchmarking Data